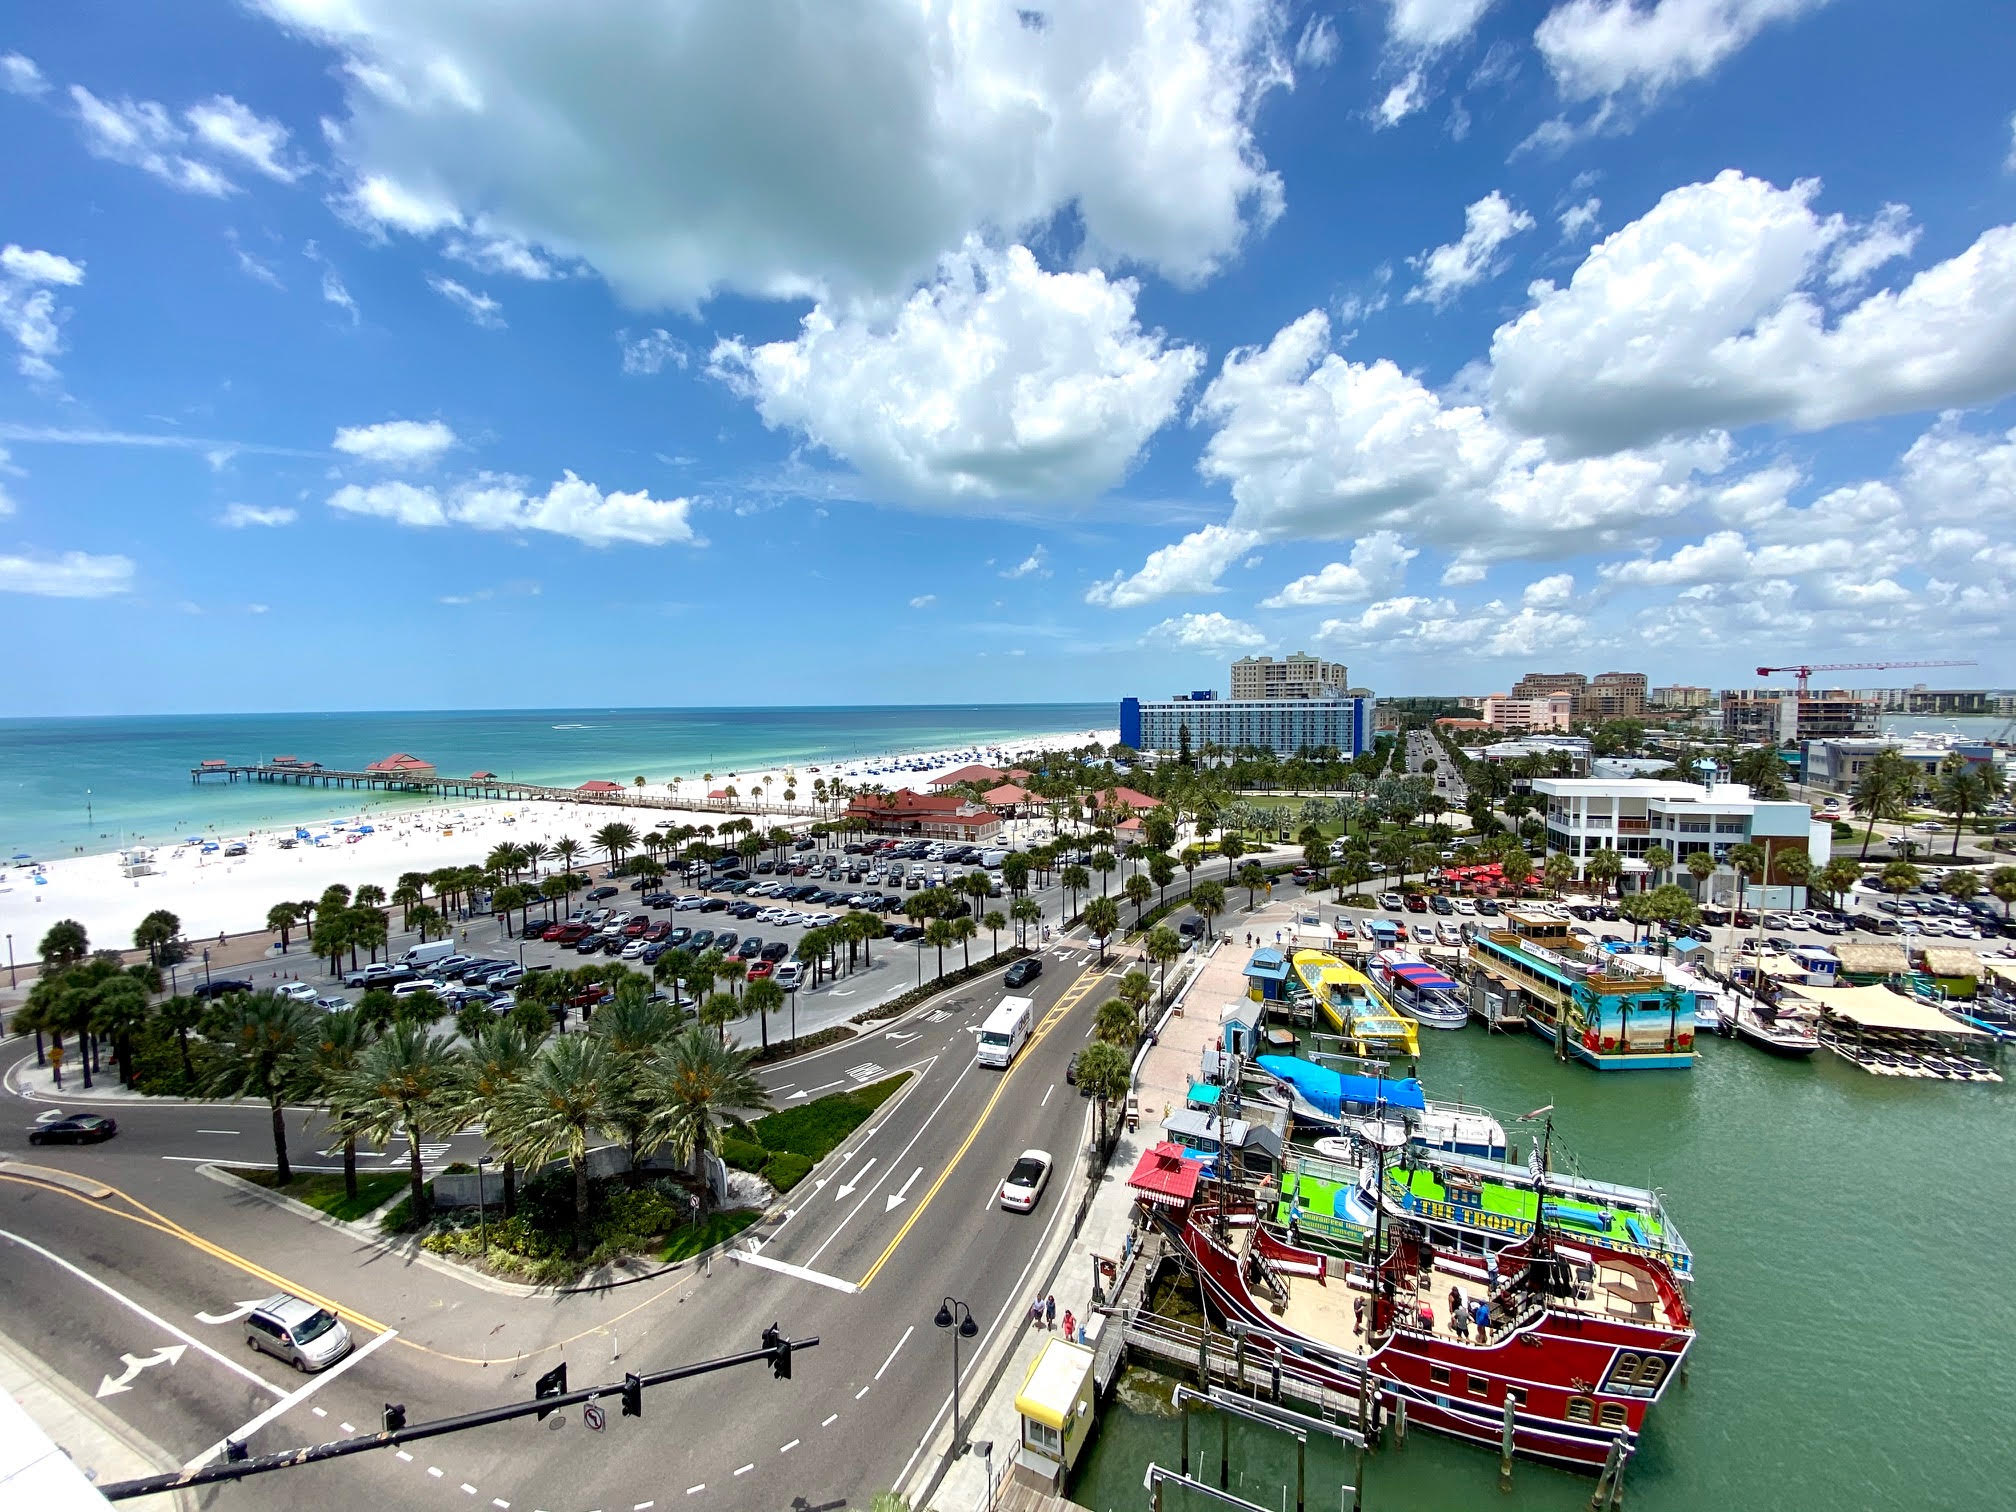
Market Update for Clearwater Beach 33767
The housing market for all property types in the Clearwater Beach area continues to show strong gains in July. The median price of all home types jumped 40.2% year over year. Homes are going under contract on average within 13 days of listing and selling for as much as 96% of original list price. Closed sales slipped this month, but we already see a rise in new listings going into August. The median price for single family homes was $1,235,000 in July up 7.4% YOY. Single family home closings average about 8-10 a month and only 6-8 new listings per month come on the market.
The condo market had 65 new listings the highest in 12 months. There were only 37 closed condo sales in July which was the lowest number since May of 2020. The average sale price of a condo was $791,403 up 38% YOY and the second highest average in the last 2 years. Condos were in line selling for 96.7% of list price and selling quickly going under contract in 13 days. Inventory was the highest in 4 months but still well below anything normal at just .91 months.
One thing for sure is this market is anything but normal. Typically, the next few months should be the slower months for real estate here. But may not be the case now. Some buyers have gotten frustrated and dropped out of the house hunt for now. However, many buyers are still active, and more are surely on the way of there is any other type of lockdown scenario. Florida appears it will remain open for business. Clearwater remains one of the nicest places to call home and we hope to see you on your next visit.
 Total sold dollar volume July $54,169,425, up 16.7% YOY
Closed sales 47, down 29.9% YOY. In June of 2021 there were 70 closings. The 2-year high was 83 in April of 2021. The 5-year monthly average is 62.
Median Sold Price $715,000, up 40.2% YOY from July 2020 $510,000. The 5-year average is $541,500.
Median days properties are staying on the market 13. Last month it was 10 and one year ago it was 14.
Months of Inventory is up 20% MOM to 1.06 months. Down 76.7% YOY from one year ago when there was over 4 months of inventory available.
New Listings are up 42.3% to 74. In July of 2020 there were 92. The 5-year average is 62.
Average Sale Price to List Price Ratio is up to 96%. In July of 2020 it was 92.2% and the 5-year average is 93.4%.
*Stats are for the Clearwater Beach area 33767 zip code and includes all property types for the month of July 2021.
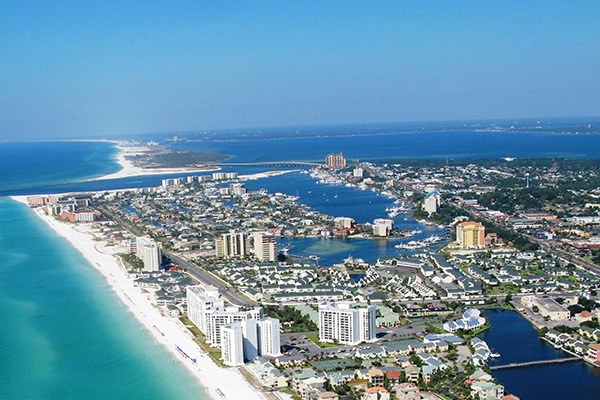
Housing Market Update for St. Pete Beach 33706
The housing market for all property types in the St. Pete Beach area showed strong gains in July much like Clearwater Beach. Homes are still more affordable than Clearwater Beach by $215,000 according to the median home price stat. The median home price for a single-family home was $942,500 the third highest mark in the last 5-years. The condo market in St. Pete is also at 5-year highs with room for prices to climb. Properties are going under contract fast with no signs letting up. Sellers are testing the market and coming out on top getting close to 100% of listing price.
The condo market had just 40 new listings the lowest since April 2020. New listings for condos have been high the last 4 months setting new highs so this month may be the market taking a step back to regroup. There were 56 closed condo sales in July which was about the average for the last 2 years. New listings are down so inventory could be even tighter the next month or two. The average sale price of a condo rose considerably to $590,306 up 59.1% YOY the highest in the last 5 years. Condos in St. Pete are selling for 99.3% of list price, this too at the highest levels in 5 years. The median time a condo is staying on the market is just 6 days.
Total sold dollar volume July $56,454,723, up 8.9% YOY
Closed sales 77, down 17.2% YOY. In July of 2020 there were 93 total closings, and the 2-year high was 107 in March 2021. The 5-year monthly average is 74.
Median Sold Price $500,000, up 8.7% YOY from July 2020 $460,000. The 5-year average is $428,600.
Median days properties are staying on the market 7. Last month it was 6 days and one year ago it was 38 days.
Months of Inventory is up slightly to .78 from .60 in June. Inventory is down 70.6% YOY. The 2-year high was April 2019 when it was 4.06 months.
New Listings were up 4.3% YOY to 73 and slightly higher than the 5-year average of new listings in July of 66. The 2-year high was March 2021 with 101 new listings.
Average Sale Price to List Price Ratio is 98.8% up 1.9% YOY. In July of 2020 it was 94.6% and the 5-year average is 94.2%.
*Stats are for the St. Pete Beach area 33706 zip code and includes all property types for the month of July 2021.
Thank you for reading our housing market report for the beaches of Clearwater and St. Pete. We hope you have found it helpful. If you would like a custom report of a particular condo community, neighborhood, city, or county please let us know by emailing stephen@tomsmithteam.com.
If you are interested in listing your home for sale or have questions about the buying process here, we would love to hear from you today. You can call or text Tom Smith at 727-776-3375 or Kristin Vincelli at 727-686-1596 today.
The Tom Smith Team has sold over $175,000,000 and is ranked in the top 1% of all agents in Pinellas County. Our team’s extraordinary sales success is a result of our foundation which is built on trustworthiness, responsiveness, local market knowledge and an excellent reputation in the community.
See you on the beach soon!
