Real Estate News & Market Trends compliments of Beachwise Real Estate.  Expert analysis on the State of the Pinellas County Housing Market is Here.    

You’ll find our blog to be a wealth of information, covering everything from local market statistics and home values to community happenings. That’s because we care about the community and want to help you find your place in it. Please0 reach out if you have any questions at all. We’d love to talk with you!  Beachwise Real Estate is ranked in the top 1% out of 8,000 Realtors in Pinellas County with over $300 Million Sold!

Beachwise Real Estate has consistently ranked in the TOP 500 realtors out of 15,000 Realtors in the Tampa Bay Area.  Thank you to all our friends and our wonderful team that allow us the opportunity to serve.

Sept. 26, 2025

Pinellas County’s Hottest Housing Markets: Top 3 Areas Set to Rise in Value Through 2030


A Beachwise Special Report    

Pinellas County real estate is evolving fast — and savvy buyers, sellers, and investors want to know where the next wave of appreciation is headed.

A person surfing in the ocean

AI-generated content may be incorrect.


Our latest Beachwise Insider Report highlights the Top 3 areas projected to see the strongest growth from 2025 to 2030. From the energy of Downtown St. Petersburg to the charm of Dunedin and Palm Harbor, to the resiliency-driven comeback of our barrier island communities, these are the places leading the way in value, lifestyle, and long-term opportunity.

Here are three areas in Pinellas County, FL that are showing strong signs of real estate appreciation (or have structural advantages that often lead to appreciation). These are good “watch zones” if you’re hunting for upside opportunities:


1. St. Petersburg (especially waterfront, downtown, and redevelopment corridors)

  • The city continues to show steady growth, with a mix of revitalized neighborhoods, infill development, and waterfront demand.
  • Its diverse submarkets allow for both luxury and mid-tier investments, giving flexibility in risk vs reward.
  • Redevelopment of old industrial or vacant parcels near the waterfront or near transit/connectivity tends to create strong upward momentum.

2. Dunedin / Palm Harbor Corridor

  • These areas are benefiting from being close enough to the coast while offering more “breathing room” in land, making new development or remodels more feasible.
  • The market report covering St. Petersburg, Dunedin & Palm Harbor signals strong fundamentals there — good demand, less extreme volatility, and stable price trends.
  • Especially in Palm Harbor, there is a premium for family-friendly neighborhoods, good school zones, and accessibility to both Tampa Bay and Gulf beaches.

3. Waterfront / Coastal and Gulf-Front Communities (e.g. Madeira Beach, Redington, Treasure Island area adjustments)

  • Waterfront property remains a major driver in Pinellas. Homes directly on water or with boat access tend to resist broad market downturns better.
  • After the recent hurricanes and damage, some beachfront or coastal properties are being sold at adjusted values, which creates potential entry points—with upside as repair, resiliency programs, and renourishment continue.
  • Coastal towns that combine tourism, local amenities, and access (beach, marinas, restaurants) have historically commanded premium appreciation.

A person pointing at a house

AI-generated content may be incorrect.

Top 3 appreciation zones (5-year outlook)

  1. Downtown St. Petersburg near-core neighborhoods
    Projected 5-yr growth rate: 12%–15%
    Why: job/amenity density, continued infill & redevelopment, year-round demand, and a deep buyer pool. Even with 2024–25 cooling, St. Pete’s long structural story remains intact. Recent data shows a dip vs. last year (resetting comps), which can set the stage for steadier gains going forward.
  2. Dunedin → Palm Harbor corridor (walkable cores and good schools)
    Projected 5-yr growth rate: 7%–10%
    Why: high livability, historic downtown charm (Dunedin), family appeal (Palm Harbor), and access to both Tampa Bay & beaches. Data shows year-over-year softness today, but these submarkets have resilient, end-user demand and limited historic cores.
  3. Barrier-island recovery cluster (Madeira Beach–Treasure Island–Redington)
    Projected 5-yr growth rate: 14%–18%
    Why: coastal scarcity and tourism recovery (e.g., Thunderbird rebuild) versus hurricane/insurance headwinds. Current data shows the sharpest near-term declines (creating entry points); medium-term upside varies by elevation/resiliency and renourishment progress. Expect elevated/renovated gulf & canal homes to be a key driver of growth.

The Why

  • The latest data shows markets have been correcting in the last 12 months. We are looking at 2024–25 as a reset period before a new growth period.
  • If mortgage rates drift lower from the mid-6s and income growth persists, Pinellas should revert toward modest nominal appreciation.
  • Local fundamentals are attractive: walkability, waterfront scarcity, and policy/rebuild catalysts (renourishment, resiliency programs, hotel inventory recovery) support the above zones—especially for upgraded/elevated properties on the islands.

What would change the numbers (up or down)

  • Faster-than-expected rate declines (refi wave), successful beach renourishment & resiliency execution, major employer expansions, and quicker hospitality rebuilds on the beaches.
  • Insurance shocks, slower renourishment, additional storm seasons with outsized damage, or a prolonged high-rate environment.

Thank you for taking the time to read this special report.  We hope you find it helpful.  If you are thinking about buying or selling in these markets or anywhere in Pinellas County, we would like the opportunity to share our expertise and knowledge of the area with you.  Our expertise and commitment to treating each client as our only client has led us to be in the TOP 1% out of over 8,000 realtors in Pinellas County and in the top 3% out of over 15,000 agents in the entire Tampa Bay area several years in a row.

You see, we believe real estate is about more than transactions—it's about dreams, families, and futures. We commit our full attention and boundless determination to each client, treating every deal with the care and dedication it deserves.

Located in beautiful downtown Clearwater you can reach us there at 727-214-2420 or call or text Kristin Vincelli, broker, at 727-686-1596.  You may also email us at Kristin@beachwiserealestate.com with your requests. 

Please visit us at www.beachwiserealestate.com for free resources like home search tools, market reports and breaking news.

Follow us on Facebook for special updates and news or just to see what we are up to:
Beachwise Real Estate FB
Kristin Vincelli FB
Instagram @Rollerblading Realtor

See you on the beach!

Posted in Market Updates
Sept. 23, 2025

Our 8 Best Places and Activities on Treasure Island FL

Most Loved Places & Activities on Treasure Island

  1. Treasure Island Beach
  2. Sunset Beach
  3. Water Activities (Paddleboarding, Kayaking, Parasailing, Fishing, etc.)
    • Paddleboard/kayak rentals are popular. Many visitors like being on the water — exploring, seeing wildlife (dolphins, seabirds). VISIT FLORIDA+2The Molloy+2
    • Fishing charters / shelling / snorkeling trips also are frequently recommended. expedia+1
  4. Walks, Trails & Bike Along the Shore
  5. John’s Pass Village & Boardwalk (Madeira Beach area)
    • Even though it’s just outside Treasure Island proper, many visitors list John’s Pass for shopping, dining on seafood, strolling the boardwalk, boat rentals, etc. expedia+1
  6. Local Dining & Beachfront Bars
  7. Events & Festivals
  8. Shopping Local / Local Shops & Culture

👉 Thinking about buying or selling on Treasure Island?  Click this link to see all the active listings on Treasure Island $200k and up TREASURE ISLAND ACTIVE LISTINGS HOME AND CONDO

Call us at 727-686-1596 or visit BeachwiseRealEstate.com to see how our expertise can help you make the most of this resilient Gulf Coast market.  

Beachwise Real Estate is ranked in the top 1% out of 8,000 Realtors in Pinellas County with over $300 Million Sold!

Beachwise Real Estate has consistently ranked in the TOP 500 realtors out of 15,000 Realtors in the Tampa Bay Area. 

Thank you to all our friends and our wonderful team that allow us the opportunity to serve.

Posted in Leisure
Sept. 23, 2025

Treasure Island: From Hurricanes to Hope — What’s Next for Real Estate

At Beachwise Real Estate, we know Treasure Island is more than just a destination — it’s a resilient community. Over the past year, our barrier-island city has endured back-to-back hurricanes, absorbed hard lessons, and launched ambitious plans that may shape property values for decades to come. Here’s what you need to know.


The Storms That Shook Treasure Island

In late 2024, Hurricanes Helene and Milton slammed into Pinellas County. Nearly every structure on Treasure Island sustained some level of damage.

  • The City amended its FY25 budget to recognize about $3.28 million in storm expenses and logged $1.89 million in insurance proceeds, but those figures only capture municipal costs — not the widespread private and commercial losses across the island.

  • For perspective, countywide damages from Debby, Helene, and Milton combined reached an estimated $2.434 billion, and more than 1 million cubic yards of sand were washed from our beaches.

  • The beloved Thunderbird Beach Resort alone reported over 80% of its property damaged and is now preparing for a complete rebuild.


Rebuilding Smarter: Treasure Island’s Vision

Out of this adversity comes opportunity. The city is taking bold steps to not just rebuild — but to reimagine its future:

  1. Vision 2042 Comprehensive Plan
    Policies now emphasize smarter land use, resilient infrastructure, and coastal management designed for long-term sustainability.

  2. Elevate Treasure Island Program (May 2025)
    Property owners can now voluntarily raise sites, seawalls, and structures with fill — a groundbreaking shift from the city’s historic no-fill rule. This will directly affect flood insurance, safety, and ultimately, home values.

  3. Zoning & Land Development Updates
    New regulations will better align with resilience goals, opening doors for mixed-use projects and streamlined approvals.

  4. Affordable Housing & Infrastructure
    Diversity in housing types, upgrades to utilities, stormwater management, and coastal protections are all on the agenda.

  5. Tourism Recovery
    The Thunderbird will return as a modern 4-story resort, ensuring Treasure Island continues to thrive as a Gulf Coast vacation hub.


What It Means for Real Estate

For buyers and investors, Treasure Island’s path forward presents both risks and opportunities:

  • Winners: Elevated canal homes on Isle of Palms & Isle of Capri, gulf-front parcels that benefit from renourishment, and Gulf Blvd properties boosted by Thunderbird’s revival.

  • Medium-Term Gainers: Parcels in new mixed-use zones and homes that combine elevation with storm-ready design.

  • Watchouts: Legacy low-lying properties that don’t adapt may lose ground in value relative to resilient neighbors.


The Beachwise Takeaway

Yes — Treasure Island has weathered storms, and yes — the recovery is costly. But the city’s commitment to resiliency, smarter planning, and renewed tourism infrastructure positions the island for a stronger, more sustainable future.

For homeowners, that means opportunities to add value through elevation, smart retrofits, and adaptive design. For investors, it means a market where the best-protected properties will command premiums in resale and rental demand.

At Beachwise Real Estate, we’re here to help you navigate this evolving landscape — because the Treasure Island story isn’t about destruction, it’s about rebuilding better. 🌅

If Treasure Island is on your list, NOW is a great time to buy.  Prices may have just hit the floor, and we could see the beginning of sustained appreciation.

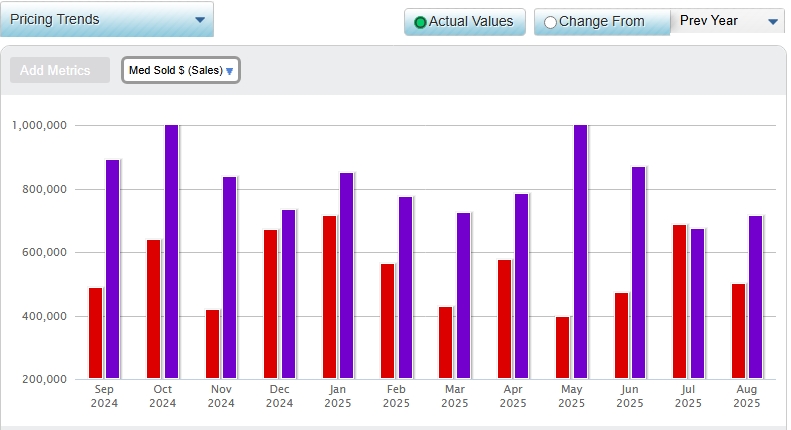
Current Market Date through August 2025 for 33706 Treasure Island:


Single family - Purple
Condo - Red 


👉 Thinking about buying or selling on Treasure Island? Now would be a great time to talk to an expert while values are down.  Call us at 727-686-1596 or visit BeachwiseRealEstate.com to see how our expertise can help you make the most of this resilient Gulf Coast market.

Beachwise Real Estate is ranked in the top 1% out of 8,000 Realtors in Pinellas County with over $300 Million Sold!

Beachwise Real Estate has consistently ranked in the TOP 500 realtors out of 15,000 Realtors in the Tampa Bay Area. 

Thank you to all our friends and our wonderful team that allow us the opportunity to serve.

Posted in Market Updates
Sept. 21, 2025

Discover Why Pinellas County is Florida's Hidden Gem for Smart Real Estate Investment

From the Team at Beachwise Real Estate

Part 1

Are you considering a move to Florida or are you looking to invest in one of the state's most promising markets? Let us introduce you to Pinellas County – a remarkable region that's quietly becoming one of Florida's most attractive destinations for both lifestyle and investment. 

A Thriving Economic Powerhouse

Pinellas County isn't just about beautiful beaches (though we certainly have those!). The St. Petersburg-Clearwater-Largo area has earned recognition as the #17 Leading Metro Location in the nation for thriving cities, ranking high in workforce availability, economic strength, and affordability. Even more impressive? We rank #10 nationally for Prime Workforce, attracting top talent and innovative companies to our region.

This economic momentum is translating into real opportunities. With key industries like technology, real estate, and tourism leading significant growth in 2025, Pinellas County is positioned at the forefront of Florida's economic expansion.

Affordability That Makes Sense

While many Florida markets have seen dramatic price increases, Pinellas County maintains a competitive edge. Our median home prices remain close to or below national averages, particularly in St. Petersburg, making homeownership achievable for a broader range of buyers. With median household incomes growing 5.85% year-over-year to $70,293, residents are experiencing both wage growth and reasonable housing costs – a combination that's increasingly rare in today's market.

Lifestyle Beyond Compare

Pinellas County offers an unmatched quality of life that draws experienced professionals ready to advance their careers in sunny Florida. From our award-winning beaches to vibrant downtown areas, cultural attractions, and year-round outdoor activities, residents enjoy the perfect blend of urban sophistication and coastal living.

Smart Growth for the Future

Unlike some rapidly expanding Florida counties experiencing growing pains, Pinellas County is seeing steady, manageable growth of 3.3% through 2026. This measured expansion means improved infrastructure and amenities without the chaos of overdevelopment. Current redevelopment projects throughout the county are strategically revitalizing key areas while preserving the character that makes our communities special.

Rankings & Key Statistics:

Economic Development & Business Climate:

  • The St. Petersburg-Clearwater-Largo area ranks No. 17 in Area Development's Leading Metro Locations report for thriving cities for factors like prime workforce availability, economic strength, and affordability
  • Ranked No. 10 for Prime Workforce by Area Development in 2024 Leading Metro Locations report Talent & Workforce - Pinellas County Economic Development

Demographics & Income:

Economic Outlook:

Affordability Context:

  • The median home price in St. Petersburg is slightly lower than the U.S. national average

Your Local Advantage

At Beachwise Real Estate, we've watched Pinellas County evolve and grow. We understand the nuances of each neighborhood, from Clearwater's beachfront communities to St. Petersburg's emerging districts. Whether you're a first-time buyer looking for affordability, an investor seeking growth potential, or a seller wanting to capitalize on our strong market, our local expertise ensures you make informed decisions.

The bottom line? Pinellas County offers what many Florida markets can't: strong economic fundamentals, reasonable affordability, exceptional lifestyle, and sustainable growth prospects – all in one beautiful coastal package.

Ready to explore what Pinellas County can offer you? Contact Beachwise Real Estate today for a personalized consultation about buying or selling in one of Florida's most promising markets.

Beachwise Real Estate
Your Local Market Experts
Clearwater, FL
Call Kristin 727-686-1596
Email Kristin@beachwiserealestate.com

Beachwise Real Estate is ranked in the top 1% out of 8,000 Realtors in Pinellas County with over $300 Million Sold!
Beachwise Real Estate has consistently ranked in the TOP 500 realtors out of 15,000 Realtors in the Tampa Bay Area.  Thank you to all our friends and our wonderful team that allow us the opportunity to serve.
Posted in Market Updates
Sept. 14, 2025

Special Report Pinellas County Real Estate Surges - August Sales Activity Explodes Across All Markets

In this report: key analysis and market insight into several cities in Pinellas County.  Thinking about buying or selling?  This report is for you.

Speak with an expert today!  Text or call:
Kristin Vincelli, Broker, 727-686-1596
Stephen Vincelli, Realtor, 727-430-1995
Tom Smith, Realtor, 727-776-3375

#1 Clearwater Beach (33767) Market Update - August 2025

Market Summary: The Clearwater Beach luxury market is experiencing exceptional momentum with remarkable buyer activity surging across both property types. Condo prices jumped an impressive 39.1% month-over-month while single family homes reached a premium $1.73M median, showcasing the area's strong appeal. New pending’s exploded with an 118% increase for condos and 133% for single family homes, demonstrating robust buyer demand. The market is positioned strongly with year-to-date single-family sales up 37.8% and new listings increasing significantly, indicating a healthy and active luxury beachfront housing market going into the fall.

Condo/Co-op/Townhome Market

Median Sold Price: $560,000

  • ↑ 39.1% from July 2025 ($402,500)
  • 5-year August average: $671,200
  • Year-to-date median: $650,000 (down 0.5% vs 2024)

Closed Sales: 17

  • ↑ 6.3% from July 2025 (16)
  • 5-year August average: 26
  • Year-to-date: 158 sales (down 33.3% vs 2024)

New Listings: 38

  • ↑ 22.6% from July 2025 (31)
  • 5-year August average: 40
  • Year-to-date: 446 listings (up 4.9% vs 2024)

New Pendings: 24

  • ↑ 118.2% from July 2025 (11)
  • 5-year August average: 31
  • Year-to-date: 207 pendings (down 29.1% vs 2024)

Single Family Home/Villa Market

Median Sold Price: $1,730,000

  • ↑ 5.5% from July 2025 ($1,640,000)
  • 5-year August average: $1,396,600
  • Year-to-date median: $1,217,000 (down 16.6% vs 2024)

Closed Sales: 4

  • ↓ 33.3% from July 2025 (6)
  • 5-year August average: 5
  • Year-to-date: 62 sales (up 37.8% vs 2024)

New Listings: 11

  • 22.2% from July 2025 (9)
  • 5-year August average: 10
  • Year-to-date: 95 listings (up 33.8% vs 2024)

New Pendings: 7

  • ↑ 133.3% from July 2025 (3)
  • 5-year August average: 6
  • Year-to-date: 64 pendings (up 30.6% vs 2024)

#2 City of Clearwater Market Update - August 2025

Market Summary: The Clearwater City market demonstrates solid stability and steady growth momentum across both property segments. Condo sales surged 14.4% month-over-month with prices climbing 3.4%, while single family home sales increased 9.5% with stable pricing near $395K. Year-to-date performance shows positive trends with single family sales up 4.4% and new listings increasing 5.3%, reflecting healthy market activity. Both markets maintain consistent transaction volumes with strong buyer engagement, positioning Clearwater as an attractive and stable real estate destination.

Single Family Home/Villa Market

Median Sold Price: $394,950

  • No change from July 2025 ($395,000)
  • 5-year August average: $405,390
  • Year-to-date median: $413,250 (down 0.4% vs 2024)

Closed Sales: 138

  • ↑ 9.5% from July 2025 (126)
  • 5-year August average: 146
  • Year-to-date: 1,004 sales (up 4.4% vs 2024)

New Listings: 155

  • ↓ 0.6% from July 2025 (156)
  • 5-year August average: 156
  • Year-to-date: 1,320 listings (up 5.3% vs 2024)

New Pendings: 155

  • ↓ 3.7% from July 2025 (161)
  • 5-year August average: 170
  • Year-to-date: 1,254 pendings (up 3.6% vs 2024)

Condo/Co-op/Townhome Market

Median Sold Price: $182,500

  • ↑ 3.4% from July 2025 ($176,500)
  • 5-year August average: $206,600
  • Year-to-date median: $188,500 (down 12.3% vs 2024)

Sales Closed: 103

  • ↑ 14.4% from July 2025 (90)
  • 5-year August average: 126
  • Year-to-date: 752 sales (down 5.6% vs 2024)

New Listings: 127

  • ↑ 0.8% from July 2025 (126)
  • 5-year August average: 142
  • Year-to-date: 1,268 listings (down 5.7% vs 2024)

New Pendings: 102

  • ↓ 18.4% from July 2025 (125)
  • 5-year August average: 136
  • Year-to-date: 914 pendings (down 8.5% vs 2024)

St. Pete Beach (33706) Market Update - August 2025

Market Summary: St. Pete Beach shows strong buyer momentum with impressive sales activity surging across both property types in August. Condo sales jumped 56.3% from July while single family home pendings exploded by 62.5%, demonstrating robust buyer interest in this premier beachfront location. Year-to-date metrics reveal solid growth with single family sales up 12.6% and new listings increasing 14.7%, indicating healthy market supply and demand. The market is attracting serious buyers who appreciate the unique value proposition of St. Pete Beach's desirable waterfront lifestyle.

Condo/Co-op/Townhome Market

Median Sold Price: $500,000

  • ↓ 27.2% from July 2025 ($686,750)
  • 5-year August average: $476,800
  • Year-to-date median: $479,000 (down 10.5% vs 2024)

Closed Sales: 25

  • ↑ 56.3% from July 2025 (16)
  • 5-year August average: 29
  • Year-to-date: 159 sales (down 36.7% vs 2024)

New Listings: 24

  • ↓ 17.2% from July 2025 (29)
  • 5-year August average: 37
  • Year-to-date: 321 listings (down 21.1% vs 2024)

New Pendings: 12

  • ↓ 42.9% from July 2025 (21)
  • 5-year August average: 30
  • Year-to-date: 175 pendings (down 37.5% vs 2024)

Single Family Home/Villa Market

Median Sold Price: $715,000

  • ↑ 5.9% from July 2025 ($675,000)
  • 5-year August average: $1,057,900
  • Year-to-date median: $780,000 (down 37.5% vs 2024)

Closed Sales: 26

  • ↑ 4.0% from July 2025 (25)
  • 5-year August average: 23
  • Year-to-date: 223 sales (up 12.6% vs 2024)

New Listings: 31

  • ↓ 13.9% from July 2025 (36)
  • 5-year August average: 22
  • Year-to-date: 336 listings (up 14.7% vs 2024)

New Pendings: 39

  • ↑ 62.5% from July 2025 (24)
  • 5-year August average: 24
  • Year-to-date: 280 pendings (up 12.9% vs 2024)

#4 Madeira Beach (33708) Market Update - August 2025

Market Summary: Madeira Beach experienced exceptional sales momentum in August with both property types delivering impressive transaction volume increases. Condo sales skyrocketed by 136.4% month-over-month while single family home sales grew 23.8%, demonstrating strong buyer confidence in this desirable beachfront community. The market shows healthy inventory growth with single family new listings surging 60.9% and year-to-date sales up 16.8%, indicating robust market activity. Both segments match or exceed their 5-year August averages for closed sales, positioning Madeira Beach as an active and attractive coastal market.

Condo/Co-op/Townhome Market

Median Sold Price: $407,000

  • ↑ 7.1% from July 2025 ($380,000)
  • 5-year August average: $487,100
  • Year-to-date median: $495,000 (down 17.5% vs 2024)

Closed Sales: 26

  • ↑ 136.4% from July 2025 (11)
  • 5-year August average: 26
  • Year-to-date: 159 sales (down 28.7% vs 2024)

New Listings: 32

  • ↓ 3.0% from July 2025 (33)
  • 5-year August average: 27
  • Year-to-date: 345 listings (up 0.6% vs 2024)

New Pendings: 24

  • ↑ 9.1% from July 2025 (22)
  • 5-year August average: 27
  • Year-to-date: 187 pendings (down 19.0% vs 2024)

Single Family Home/Villa Market

Median Sold Price: $597,500

  • ↑ 1.7% from July 2025 ($587,500)
  • 5-year August average: $632,750
  • Year-to-date median: $530,000 (down 26.1% vs 2024)

Closed Sales: 26

  • ↑ 23.8% from July 2025 (21)
  • 5-year August average: 25
  • Year-to-date: 215 sales (up 16.8% vs 2024)

New Listings: 37

  • ↑ 60.9% from July 2025 (23)
  • 5-year August average: 29
  • Year-to-date: 311 listings (up 14.8% vs 2024)

New Pendings: 22

  • ↓ 21.4% from July 2025 (28)
  • 5-year August average: 25
  • Year-to-date: 246 pendings (up 7.9% vs 2024)

#5 Dunedin (34698) Market Update - August 2025

Market Summary: Dunedin's real estate market demonstrates strong buyer engagement with impressive transaction volume growth across both property segments. Condo sales surged 78.6% month-over-month while achieving their 5-year August average, and single-family home pendings jumped 23.9%, indicating robust buyer interest. The single-family market shows excellent year-to-date performance with sales up 6.4% and new listings increasing 11.2%, reflecting healthy market activity. Both segments outperform historical benchmarks for sales volume, positioning Dunedin as an active and desirable market for homebuyers seeking quality and value.

Condo/Co-op/Townhome Market

Median Sold Price: $170,000

  • ↓ 45.6% from July 2025 ($312,500)
  • 5-year August average: $256,000
  • Year-to-date median: $240,000 (down 10.6% vs 2024)

Closed Sales: 25

  • ↑ 78.6% from July 2025 (14)
  • 5-year August average: 26
  • Year-to-date: 177 sales (down 12.4% vs 2024)

New Listings: 25

  • ↓ 30.6% from July 2025 (36)
  • 5-year August average: 27
  • Year-to-date: 276 listings (up 3.0% vs 2024)

New Pendings: 18

  • ↓ 25.0% from July 2025 (24)
  • 5-year August average: 25
  • Year-to-date: 204 pendings (down 14.3% vs 2024)

Single Family Home/Villa Market

Median Sold Price: $504,000

  • ↓ 2.8% from July 2025 ($518,500)
  • 5-year August average: $478,250
  • Year-to-date median: $491,000 (down 1.8% vs 2024)

Closed Sales: 47

  • ↓ 9.6% from July 2025 (52)
  • 5-year August average: 43
  • Year-to-date: 380 sales (up 6.4% vs 2024)

New Listings: 44

  • ↓ 38.0% from July 2025 (71)
  • 5-year August average: 46
  • Year-to-date: 477 listings (up 11.2% vs 2024)

New Pendings: 57

  • ↑ 23.9% from July 2025 (46)
  • 5-year August average: 52
  • Year-to-date: 449 pendings (up 5.2% vs 2024)

Palm Harbor Market Update - August 2025

Market Summary: Palm Harbor shows strong buyer momentum with impressive contract activity across both property types in August. New pendings surged 28.6% for condos while single family homes maintained robust activity with 100 new contracts, demonstrating consistent buyer interest in this desirable community. The single-family market achieved an 8.8% monthly price increase to $495K while exceeding the 5-year historical average, indicating strong market fundamentals. Year-to-date performance reflects healthy growth with single family pendings up 10.7% and positive sales trends, positioning Palm Harbor as an active and attractive residential market.

Condo/Co-op/Townhome Market

Median Sold Price: $235,000

  • ↓ 3.6% from July 2025 ($243,750)
  • 5-year August average: $245,390
  • Year-to-date median: $266,950 (up 3.4% vs 2024)

Closed Sales: 24

  • ↓ 20.0% from July 2025 (30)
  • 5-year August average: 36
  • Year-to-date: 224 sales (up 1.8% vs 2024)

New Listings: 34

  • ↑ 17.2% from July 2025 (29)
  • 5-year August average: 38
  • Year-to-date: 347 listings (down 8.2% vs 2024)

New Pendings: 36

  • ↑ 28.6% from July 2025 (28)
  • 5-year August average: 42
  • Year-to-date: 272 pendings (down 2.2% vs 2024)

Single Family Home/Villa Market

Median Sold Price: $495,000

  • ↑ 8.8% from July 2025 ($455,000)
  • 5-year August average: $479,000
  • Year-to-date median: $485,000 (down 6.7% vs 2024)

Closed Sales: 81

  • ↓ 12.9% from July 2025 (93)
  • 5-year August average: 97
  • Year-to-date: 650 sales (up 3.3% vs 2024)

New Listings: 89

  • ↓ 7.3% from July 2025 (96)
  • 5-year August average: 95
  • Year-to-date: 825 listings (up 4.4% vs 2024)

New Pendings: 100

  • ↓ 1.0% from July 2025 (101)
  • 5-year August average: 108
  • Year-to-date: 828 pendings (up 10.7% vs 2024)

Largo Market Update - August 2025

Market Summary: Largo experienced exceptional sales momentum in August with impressive price appreciation across both property segments. Condo sales increased 18.5% month-over-month with prices climbing 10.0%, while single family home sales surged 30.6% with an 11.7% price increase to $438,500. Both property types significantly exceeded their 5-year August averages for median prices, demonstrating strong market fundamentals and buyer confidence. Year-to-date performance shows healthy growth with condo sales up 9.1% and new listings increasing 15.3%, positioning Largo as a dynamic and appreciating market for homebuyers and investors.

Condo/Co-op/Townhome Market

Median Sold Price: $242,000

  • ↑ 10.0% from July 2025 ($220,000)
  • 5-year August average: $227,960
  • Year-to-date median: $244,950 (up 2.1% vs 2024)

Closed Sales: 32

  • ↑ 18.5% from July 2025 (27)
  • 5-year August average: 39
  • Year-to-date: 276 sales (up 9.1% vs 2024)

New Listings: 40

  • ↓ 16.7% from July 2025 (48)
  • 5-year August average: 43
  • Year-to-date: 429 listings (up 15.3% vs 2024)

New Pendings: 30

  • ↓ 28.6% from July 2025 (42)
  • 5-year August average: 44
  • Year-to-date: 304 pendings (up 0.7% vs 2024)

Single Family Home/Villa Market

Median Sold Price: $438,500

  • ↑ 11.7% from July 2025 ($392,500)
  • 5-year August average: $397,380
  • Year-to-date median: $405,000 (down 2.4% vs 2024)

Closed Sales: 94

  • ↑ 30.6% from July 2025 (72)
  • 5-year August average: 86
  • Year-to-date: 612 sales (down 3.5% vs 2024)

New Listings: 84

  • ↓ 16.8% from July 2025 (101)
  • 5-year August average: 99
  • Year-to-date: 800 listings (up 1.5% vs 2024)

New Pendings: 101

  • ↑ 8.6% from July 2025 (93)
  • 5-year August average: 112
  • Year-to-date: 735 pendings (down 7.9% vs 2024)

Pinellas County Market Update - August 2025

Market Summary: The Pinellas County real estate market shows encouraging signs of momentum in August 2025. Condo prices experienced a strong 8.2% monthly increase, while single family home prices remained stable, indicating market resilience. The single-family market demonstrated robust buyer activity with new pending’s up 4.8% from July and year-to-date sales outpacing 2024 by 4.3%. Both property segments are attracting increased buyer interest, positioning the market for continued growth.

Single Family Home/Villa Market Median Sold Price: $425,000

  • No change from July 2025 ($425,000)
  • 5-year August average: $427,000
  • Year-to-date median: $435,000 (down 6.0% vs 2024)

Closed Sales: 956

  • ↓ 0.5% from July 2025 (961)
  • 5-year August average: 1,011
  • Year-to-date: 7,619 sales (up 4.3% vs 2024)

New Listings: 1,054

  • ↓ 7.9% from July 2025 (1,144)
  • 5-year August average: 1,118
  • Year-to-date: 10,356 listings (up 9.9% vs 2024)

New Pending’s: 1,137

  • ↑ 4.8% from July 2025 (1,085)
  • 5-year August average: 1,208
  • Year-to-date: 9,431 pending (up 6.8% vs 2024)

We would love to hear from you.

Thinking of selling in this market?  Let us show you how we do it. 
Ready to buy?  What does that perfect home look like?  Tell us here.
Get expert market analysis before you start the process, Team Beachwise

Free at Beachwiserealestate.com:
create your own customized home search
market research tools
Pro-tips and analysis

Follow us @
Kristin Vincelli Rollerblading Realtor  
Rollerblading Realtor Instagram
Beachwise Real Estate Facebook


600 Cleveland St, Suite 219
Clearwater, Fl 33755
Office #727-214-2420
Kristin Vincelli, Broker
Lic #BK3311032
Contact (727) 686-1596
 

Posted in Market Updates
Sept. 9, 2025

Mortgage Rates Just Hit Their Lowest Level of 2025!

From the desk of Drake Beaulieu, Lincoln Lending,

This is the window buyers have been waiting for. More affordability, more buying power, and a chance to secure the best terms we’ve seen all year.  September 17 and December 10th are the next two FOMC meetings where the FED will decide to lower rates even more. 

Did you know rates hit a 10-month low this month! The 30-year fixed dropped to 6.56%, the most affordable level since early 2025.

ARMs gaining traction. With the Fed expected to cut rates, ARMs could fall closer to 5.5%, giving buyers an edge.


📊 Market Snapshot (This Week)

30-Year Fixed Avg: 6.56% (lowest of 2025)

15-Year Fixed Avg: 5.98%

5/6 ARM Avg: 5.75%


 Buyer’s Corner — September Advantage

Rates are at 2025 lows → more home for your budget.

Seller credits remain common → cover buydowns + closing costs.

Stack strategies → pair an ARM with a 2-1 buydown for the lowest short-term payment.


Summary

Rates are the lowest they’ve been all year — you have more buying power today than last month.

💡 ARMs are saving buyers $300–$500/month right now — a smart bridge until rates fall.

🏡 Seller credits are back. We can use them to buy down your rate or cover closing costs.

A 2-1 buydown + ARM can make your first-year payment feel like 2021 again.

🔑 Even if you refinance later, the key is getting into the home now with lower upfront costs.


FAQ of the week

Q: Should I wait until 2026?

👉 Waiting could mean higher home prices. Buying now with today’s low rates + seller credits = stronger position.

Q: What if I don’t qualify today?

👉 We can pre-plan: credit tune-up, income strategy, and a roadmap to qualify in 3–6 months.


Are you considering financing a home?  Our team has been referring clients to talk with Drake for over 6 years with confidence. Drake can do things most lenders cannot, and his team gets it done quickly and efficiently.  It’s always good to get a second opinion from a seasoned expert.  Give Drake at Lincoln a call if you are thinking about buying.      

Posted in Tips For Buying
Sept. 6, 2025

Special Report

In this report!

*Key Analysis
*6 Reasons Why Dunedin Real Estate Will Keep It at the Top!
*Major Development Projects Coming Up in Dunedin

🚨 Dunedin Market Update – July 2025 🚨

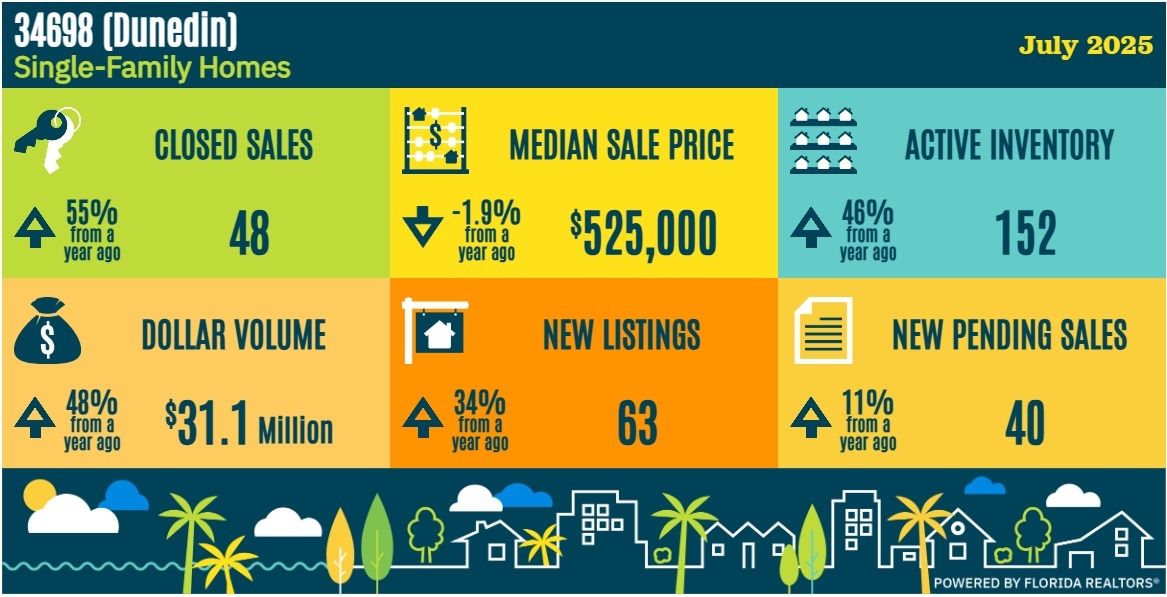
The numbers are in, and Dunedin’s housing market is showing some BIG shifts:
✔️ Closed sales up 55% from last year
✔️ Dollar volume up 48%
✔️ Inventory up 46% (more homes to choose from!)
✔️ New listings up 34%
✔️ Median price slightly down -1.9%

📉 Prices are softening a bit, but buyer demand is still strong. With more inventory hitting the market, buyers have leverage — and sellers need smart pricing + strategy to stand out.

Follow us on Facebook Beachwiserealestate


🏡 Trend Insights

  • Sales activity is much stronger than last year, with both dollar volume and closed transactions significantly higher.

  • Prices are softening slightly despite higher sales, suggesting increased buyer leverage due to higher supply.

  • Inventory levels are nearly 50% higher than last year, giving buyers more choices.

  • New listings outpaced pending sales, signaling a more balanced to buyer-leaning market.

  • Pending contracts remain positive year-over-year, showing continued demand despite rising supply.


6 Reason Dunedin Real Estate is Special?

Natural Beauty
: Dunedin is home to unspoiled islands, white-sand beaches, miles of trails Dunedin Florida - Things to Do & Attractions in Dunedin FL, and serves as the Home of Honeymoon Island, the #1 state park in Florida Visit Dunedin, Fl - The Official Tourisim Guide to Dunedin Florida- travel, vacation and relocation. The area features clear emerald green waters with baby powder like sandy beaches on the Gulf of Mexico Visit Dunedin, Fl - The Official Tourisim Guide to Dunedin Florida- travel, vacation and relocation.

Charming Downtown: The city has a lively, bike-friendly downtown of quaint shops, craft breweries, and independent eateries Dunedin Florida - Things to Do & Attractions in Dunedin FL. This small, cozy community has a vibe that's equal parts relaxed and vibrant The 14+ Best Things to Do in Dunedin, Florida, and it's pedestrian- and pup-friendly, making it the perfect spot for a laid-back stroll The 14+ Best Things to Do in Dunedin, Florida.

Craft Beer Scene: The city boasts an abundance of craft beer, with perhaps more breweries Cool Block in Dunedin: Walking Main Street, Day and Night | VISIT FLORIDA than you'd expect for its size, making it a destination for beer enthusiasts.

Island Access: Dunedin provides access to two premier state parks - Caladesi Island State Park and Honeymoon Island State Park, both known for their pristine beaches and natural beauty.

Location and Atmosphere: This town feels like a throwback to a simpler, more serene Florida. Here, the pace is relaxed Dunedin | Visit St Petersburg Clearwater Florida, while being conveniently located just 30 minutes west of Tampa on Florida's Gulf Coast Dunedin Florida - Things to Do & Attractions in Dunedin FL.

Festivals and Events: The city hosts the largest Mardi Gras parade in Florida 15 Amazing Things To Do In Dunedin Florida - Wander Florida and celebrates St. Patrick's Day with street festivals that engage the entire downtown area.

Bonus!  Major Development Projects on the Table:

  • Dunedin Marina: Marina restoration remains a top priority for 2025, with June set as the estimated completion date Florida Economic Forecast 2024–2030 Q1 2025
  • New Pocket Park: The former City Hall site is set to become a pocket park, adding natural outdoor space to the City's more than 350 acres of greenspace Florida Economic Forecast 2024–2030 Q1 2025
  • Aquatic Complex: The Highlander Park Aquatic Complex master plan is now under design and will include several new amenities, including a competitive pool, an activity pool with zero-depth entry, a therapeutic pool, and two large slides

Thank you for your interest in our report. 

💡 Whether you’re thinking of buying or selling, now’s the time to have a local expert on your side. Let’s talk strategy!

👉 Call/Text Team Beachwise, 🌐 beachwiserealestate.com

Kristin Vincelli | Broker
📲 (727) 686-1596
Kristin Vincelli Facebook

Zyon Christante, Realtor
📲 (727) 342-0088
Zyon Christante Facebook

Tom Smith, Realtor
📲 (727) 776-3375
Tom@tomsmithteam.com

Stephen Vincelli, Realtor
📲 (727) 430-1995
Stephen Vincelli Facebook

Ken Arsenault, Realtor
📲 (727) 709-7028
ken@beachwiserealestate.com


Posted in Market Updates
Sept. 1, 2025

Pinellas County Residents Home Insurance Rates Could Be Dropping in 2025!

From the desk of Kristin Vincelli, Broker Beachwise Real Estate

TRUE STORY! Just last week I helped find my buyers a beautiful waterfront home on Treasure Island this past week for $2,400,000. I have been seeing home insurance premiums somewhat stabilize the last 6 months but never thought we could see rates dropping.

When I saw the HOME INSURANCE quote, I couldn't believe it at first, the actual numbers were $2,549 a year for hazard and $840 for flood. What was amazing was this home is right on the water in a flood zone.  I knew the flood would be low since the home sets up 14 ft, but $840 was pretty amazing.  For the hazard policy in that area to be that low was pretty amazing as well considering the location, square footage with a boat slip and over 10 years old.

Looked into it a little more.

Turns out it could be true:

Why Pinellas Homeowners Pay $6,000 LESS in Insurance Than Miami? https://www.worthinsurance.com/.../florida-homeowners...

What to Expect in 2025, compared to Miami-Dade residents paying $8,854. This massive cost difference makes Pinellas increasingly attractive to buyers fleeing high-insurance are

Check out the top 5 in the state for lowest premiums

https://floridaallrisk.com/best-homeowners-insurance-in.../

It does help to have a great insurance agent to refer clients to. If you would Eric's information you can contact me by email, DM or preferred by text.

HAVE YOU NOTICED rates coming down recently? I would love to hear YOUR THOUGHTS.  Reach back out to Stephen or Kristin Vincelli.


Stephen Vincelli, Beachwise Real Estate


Meet Team Beachwise
Kristin, Tom, Stephen, Zyon, Jafar and Ken

*Thinking of selling in this market?  Let us show you how we do it.  Call 727-686-1596, or email Kristin@Beachwiserealestate.com.

*Ready to buy a home or condo?  What does that perfect home look like?  Tell us here.

*Or maybe you need some expert opinions on the state of the market?  Text Stephen at 727-430-1995.

Tools and Resources for FREE
Visit www.beachwiserealestate.com and:
create your own customized home search
market research tools
find pro tips, references and educational information anything real estate at the  Beachwise blog page

Check Team Beachwise Out Here:
Kristin Vincelli Rollerblading Realtor  
Rollerblading Realtor Instagram
Beachwise Real Estate Facebook

Office #727-214-2420
600 Cleveland St, Suite 219
Clearwater, Fl 33755
Kristin Vincelli Real Estate Broker Lic #BK3311032 (727) 686-1596
Top 1.5% of all agents in the Country!
Top 3% of all agents in the Tampa Bay Area five years in a row!
CLHMS Certified Luxury Home Marketing Specialist
Gold Key – Excellence in Professionalism
RENE- Real Estate Negotiation Specialist
“Our success is measured by how much love and dedication we pour into each relationship”

Aug. 29, 2025

Local Market Insight


A close-up of a palm tree

AI-generated content may be incorrect.

Key highlights, price trends, what it all means for buyers and sellers!
From the desk of Zyon Christante

Dear Valued Clients,

Welcome to your monthly Gulfport Real Estate Market Update. As your trusted real estate partner, I'm committed to keeping you informed about the latest market trends and conditions that may impact your real estate decisions.  After analyzing the comprehensive July 2025 data, I'm sharing an in-depth assessment of market dynamics, investment opportunities, and strategic guidance for luxury buyers, sellers, and investors navigating this evolving landscape.

The data analyzed is for single family and condo combined and tells some interesting stories - especially the contrast between the broader Pinellas County market (which is cooling but still relatively stable) and Gulfport's more dramatic growth.

📈 KEY HIGHLIGHTS

Sales Activity

  • Closed Sales: 33 homes (up 3.5% from July 2024)
  • New Pending Sales: 23 homes (down 28.1% from July 2024)
  • Cash Sales: 20 homes (up 33.3% from July 2024)
  • Cash Sales Percentage: 60.6% of all sales (down slightly from 65.2%)

💰 PRICING TRENDS

Significant Price Correction:

  • Median Sale Price: $368,000 (down 17.3% from $445,000 in July 2024)
  • Average Sale Price: $506,561 (down 36.0% from $791,000 in July 2024)
  • Total Dollar Volume: $16.7 Million (down 8.1% from $18.2 Million)

Market Negotiations:

  • Median % of List Price: 89.8% (up from 87.4% - sellers getting closer to asking price)

⏱️ MARKET TIMING

Significantly Slower Market:

  • Time to Contract: 81 days (up 26.6% from 64 days in July 2024)
  • Time to Sale: 111 days (up 27.6% from 87 days in July 2024)

🏠 INVENTORY & SUPPLY

Limited but Growing Options:

  • Active Inventory: 178 homes (up 30.9% from 136 homes)
  • Months Supply: 6.5 months (up 20.4% from 5.4 months)
  • New Listings: 37 homes (up 2.8% from 36 homes)

📊 WHAT THIS MEANS

For Buyers:

  • Buyer's Market: Significant price reductions (17-36% down)
  • More time to make decisions with 6.5 months of inventory
  • Strong cash competition (60.6% of sales are cash)
  • Properties taking nearly 3 months to sell

For Sellers:

  • Challenging Market: Much longer selling times (111 days vs 87 days)
  • Need to price very competitively due to price corrections
  • Cash buyers dominate the market
  • Inventory levels creating more competition

Market Status: Gulfport is experiencing significant market correction with substantial price drops and much slower sales activity. This represents a strong buyer's market with extended selling times.


🔍 GULFPORT vs PINELLAS COUNTY COMPARISON

Key Differences:

  • Cash Dominance: Gulfport at 60.6% vs County at 35.8%
  • Inventory Supply: Gulfport at 6.5 months vs County at 4.8 months
  • Price Impact: Gulfport down 17-36% vs County down 8-10%
  • Selling Time: Gulfport 111 days vs County 77 days

Gulfport shows a more pronounced buyer's market compared to the broader Pinellas County trends.  Data Source: Gulfport MLS | Report Date: July 2025


Meet Me Here
Zyon Christante


Ready to begin this journey?  How can we earn your business today?

Thinking of selling in this market?  Let me show you how I would do it.  Call 727-342-0088, or email zyonchristante@gmail.com.

Buyers, what does that perfect home look like? Start your search with me here!

Or, maybe you need some expert opinions on the state of the market?  Let’s schedule some time to talk more, reach me here Zyon.

Visit www.beachwiserealestate.com and create your own customized home search tool with market research tools, compare home values and get pro tips on anything real estate on the Beachwise blog page.


Posted in Market Updates
Aug. 29, 2025

Clearwater Beach 33767 Housing Market Update through July 2025

CLEARWATER BEACH REAL ESTATE MARKET ANALYSIS

July 2025 Comprehensive Market Report - ZIP Code 33767


From the Desk of Stephen Vincelli, Beachwise Real Estate, stephen@beachwiserealestate.com

Dear Valued Clients,

The Clearwater Beach real estate market has entered a transformative phase that presents both unprecedented opportunities and strategic challenges. After analyzing the comprehensive July 2025 data, I'm sharing an in-depth assessment of market dynamics, investment opportunities, and strategic guidance for luxury buyers, sellers, and investors navigating this evolving landscape.


EXECUTIVE SUMMARY: MARKET RESET IN PROGRESS

July 2025 marks a definitive shift toward a buyer-dominated market with profound implications across all segments. The data reveals:

  • Total Sales Volume: $17.8M (down 48.9% YoY, 31.2% MoM)
  • Closed Sales: 22 units (down 45% YoY, 24.1% MoM)
  • Median Price: $517,500 (down 16.9% YoY, 20.4% MoM)
  • Average Price: $811,250 (down 7.1% YoY, 9.3% MoM)
  • Active Listings: 373 units vs. 206 five-year July average (+81%)
  • Months of Supply: 12.9 months (up from 5.8 average)

This represents the most significant market recalibration since the post-2008 recovery period.


MARKET VELOCITY ANALYSIS: THE GREAT DECELERATION

Contract Activity Collapse

The July Contract Snapshot reveals the dramatic velocity shift:

  • 2021 Peak: 185 all pendings, 105 closed sales
  • 2022: 139 all pendings, 124 closed sales
  • 2023: Stabilization at 105 pendings, 69 closed sales
  • 2024: Further cooling to 105 pendings, 58 closed sales
  • 2025: Sharp decline to 69 pendings, 52 closed sales

This 63% decline from peak activity indicates a fundamental shift in buyer behavior and market dynamics.

Inventory Surge Impact

With 373 active listings against 22 monthly sales, we're seeing 12.9 months of supply—more than double the balanced market threshold of 6 months. This excess inventory creates:

  • Buyer Selection Advantage: Unprecedented choice in properties
  • Pricing Pressure: Downward pressure on asking prices
  • Extended Marketing Times: Properties averaging 97 days on market
  • Negotiation Leverage: Buyers commanding significant concessions

SEGMENT-SPECIFIC ANALYSIS

CONDOMINIUM MARKET: CORRECTION IN PROGRESS

Median Price: $402,500 (down 31.6% YoY)

The condominium segment is experiencing the most pronounced adjustment:

Investment Perspective:

  • Cash Flow Opportunities: Rental yields improving as purchase prices decline faster than rental rates
  • Entry Point Advantage: High-quality beachfront condos now accessible at 2019-2020 pricing levels
  • Vacation Rental Potential: Strong short-term rental demand continues despite ownership cost reductions

Buyer Strategy:

  • Target properties priced below $500K for maximum negotiation leverage
  • Focus on buildings with strong reserves and minimal pending assessments
  • Consider oceanfront units where price per square foot offers exceptional value

Seller Reality:

  • Price aggressively within 95% of recent comparable sales
  • Prepare for 90-120 day marketing periods
  • Budget for buyer concessions (closing costs, repairs)

SINGLE-FAMILY/VILLA MARKET: LUXURY RESILIENCE

Median Price: $1,640,000 (up 13.1% YoY)

The luxury segment demonstrates remarkable stability:

Market Dynamics:

  • Limited Supply: Only 54 active listings maintain scarcity premium
  • Quality Buyers: Serious purchasers with substantial financial resources
  • Location Premium: Beachfront and near-beach properties commanding full valuations
  • Price Integrity: 97.9% sold-to-original-list-price ratio indicates pricing discipline

Investment Analysis:

  • Wealth Preservation: Luxury beachfront real estate maintaining value during broader market softness
  • Rental Income: High-end vacation rentals generating $1,000+ daily rates in season
  • Development Potential: Teardown opportunities on valuable land parcels

Strategic Positioning:

  • Properties under $1.2M experiencing strongest demand
  • Oceanfront homes holding premium despite market conditions
  • New construction competing effectively with resale inventory

INVESTOR INTELLIGENCE BRIEFING

Cash Flow Investment Opportunities

Current market conditions create exceptional investor advantages:

Target Acquisition Strategy:

  • Condo Sweet Spot: $350K-$450K range offering 7-9% gross rental yields
  • Financing Advantage: Reduced competition allowing conventional financing options
  • Negotiation Power: 10-15% below asking price offers frequently accepted

ROI Analysis:

  • Short-term Rentals: Beachfront condos generating $150-$250/night average
  • Long-term Leases: Annual rentals yielding $36K-$48K on $400K purchases
  • Appreciation Potential: Positioned for recovery when market normalizes

1031 Exchange Opportunities

For investors seeking tax-deferred exchanges:

  • Replacement Property Abundance: 373 active listings provide extensive options
  • Timeline Flexibility: Extended marketing periods accommodate exchange deadlines
  • Value Enhancement: Acquire superior properties at discounted pricing

LUXURY MARKET DEEP DIVE

Ultra-High Net Worth Buyer Trends

The luxury segment reveals distinct patterns:

Price Stratification:

  • $1M-$2M Range: Most active segment with consistent sales velocity
  • $2M-$4M Range: Selective buying with emphasis on unique features
  • $4M+ Range: Limited activity, requiring exceptional properties/pricing

Buyer Preferences:

  • Direct Oceanfront: Premium positioning commands 20-30% price advantage
  • New Construction: Modern amenities and energy efficiency driving preference
  • Privacy Features: Gated communities and secluded locations attracting premium

Investment Motivation:

  • Primary Residence: Lifestyle-driven purchases maintaining market activity
  • Portfolio Diversification: Alternative asset allocation amid market volatility
  • Generational Wealth: Legacy property acquisitions for family use

MARKET TIMING ANALYSIS

Seasonal Patterns

July traditionally represents peak season activity, making current data particularly significant:

Historical July Performance:

  • 5-Year Average: 38 closed sales vs. 22 current
  • Typical DOM: 62 days vs. 97 current
  • Traditional Supply: 206 listings vs. 373 current

Autumn Outlook:

  • Seasonal Moderation: Expect further velocity reduction September-November
  • Snowbird Return: December-March may see modest activity increase
  • Spring 2026: Market reset likely complete, setting stage for stabilization

Economic Context

Several macro factors influence market dynamics:

Interest Rate Environment: Current rates affecting financing costs and buyer qualification Economic Uncertainty: Broader market volatility influencing discretionary real estate purchases
Population Migration: Continued Florida in-migration supporting long-term demand Tourism Recovery: Strong vacation rental demand maintaining investment appeal


STRATEGIC RECOMMENDATIONS

For Luxury Buyers:

Immediate Action Items:

  • Accelerate Timeline: Current inventory levels provide exceptional selection
  • Aggressive Negotiation: Even luxury properties accepting below-ask offers
  • Due Diligence Advantage: Extended marketing periods allow comprehensive property analysis
  • Multiple Option Strategy: Consider backup positions on secondary choices

For Sellers:

Pricing Strategy:

  • Market Reality: Price within 95-98% of recent comparable sales
  • Condition Premium: Properties requiring updates face additional pricing pressure
  • Marketing Investment: Professional photography, staging, and virtual tours essential
  • Flexibility Requirement: Prepare for price adjustments and buyer concessions

For Investors:

Acquisition Focus:

  • Cash Flow Priority: Target properties generating immediate positive returns
  • Value-Add Opportunities: Consider properties requiring minor improvements
  • Portfolio Timing: Stagger acquisitions over 6-12 months to capture market bottom
  • Exit Strategy: Plan 3-5 year hold periods for maximum appreciation capture

MARKET FORECAST: 12-18 MONTH OUTLOOK

Expected Developments:

Price Stabilization: Anticipate 5-10% additional price adjustments before stabilization Inventory Normalization: Gradual absorption reducing months of supply to 8-10 range Activity Recovery: Modest sales volume increase as prices align with buyer expectations Segment Divergence: Luxury market maintaining relative strength vs. mid-market

Key Indicators to Monitor:

  • Contract Ratio: Recovery above 0.20 signaling demand improvement
  • Days on Market: Reduction below 75 days indicating velocity increase
  • New Listing Volume: Decreased supply suggesting seller confidence return
  • Price Per Square Foot: Stabilization indicating market floor establishment

CONCLUSION: STRATEGIC OPPORTUNITY WINDOW

The Clearwater Beach market is experiencing a healthy but pronounced recalibration that creates distinct opportunities across all segments. While sellers face challenging conditions requiring strategic pricing and marketing approaches, buyers and investors are encountering the most favorable market dynamics in over a decade.

The fundamentals supporting long-term value remain intact: limited developable beachfront land, world-class amenities, consistent tourism appeal, and Florida's continued population growth. Current market conditions represent a temporary adjustment that often creates the foundation for subsequent appreciation cycles.

For luxury buyers, the combination of expanded inventory, reduced competition, and negotiation leverage creates exceptional acquisition opportunities. For investors, improved rental yields combined with reduced acquisition costs offer compelling risk-adjusted returns. For sellers, success requires realistic pricing, professional marketing, and strategic patience.

This market transition, while challenging for some, ultimately creates the conditions for sustainable long-term growth and presents opportunities for strategic participants across all segments.


Ready to Capitalize on Market Opportunities?

Meet Team Beachwise

Thinking of selling in this market?  Let us show you how we do it.  Call 727-686-1596, or email Kristin@Beachwiserealestate.com.

Ready to buy a home or condo?  What does that perfect home look like?  Tell us here.

Or, maybe you need some expert opinions on the state of the market?  Would love to help with that, reach out to Zyon or Stephen.


Visit www.beachwiserealestate.com and create your own customized home search tool with market research tools, compare home values and get pro tips on anything real estate on the Beachwise blog page.

Whether you're seeking to acquire exceptional beachfront property, optimize investment returns, or successfully navigate the selling process, expert guidance is essential in this dynamic environment.

Stephen Vincelli
Beachwise Real Estate
📧 stephen@beachwiserealestate.com
📱 727-430-1995
🌐 www.beachwiserealestate.com

Your strategic partner in Clearwater Beach real estate success


This comprehensive analysis is based on Stellar MLS data through August 8, 2025, for ZIP code 33767, combined with market intelligence and economic analysis. Individual results may vary. Please consult with qualified real estate and financial professionals before making investment decisions.

Posted in Market Updates